Complete Relative Strength Index Guide for Beginners – 2025
Introduction
Have you ever wondered how traders know when it’s the right time to buy or sell? No, they don’t have a crystal ball — they use tools like the Relative Strength Index (RSI). This handy indicator acts like a weather forecast for the markets, helping you spot when a stock or crypto is “too hot” (overbought) or “too cold” (oversold).
Whether you’re a beginner dipping your toes into investing or just curious about trading, this RSI guide will explain everything in plain English. Ready to become RSI-savvy? Let’s dive in.
1. What is the Relative Strength Index (RSI)?
The Relative Strength Index, or RSI, is a popular momentum indicator used in technical analysis. In simple terms, it tells you whether an asset is being overbought or oversold. Think of it as a “mood meter” for the market.
2. Why RSI Matters in Trading
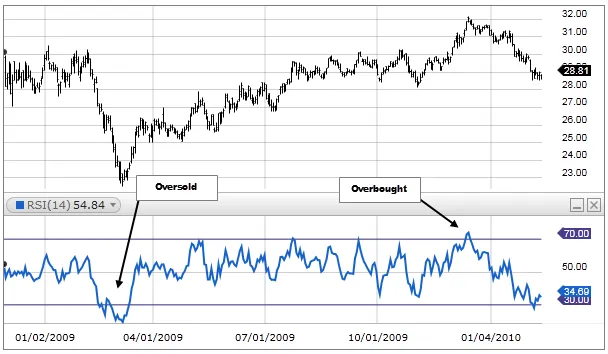
Ever heard the phrase “buy low, sell high”? RSI helps you do just that. When RSI shows a number above 70, it suggests the asset may be overbought — a potential sign to sell. If it’s below 30, the asset could be oversold — maybe time to buy.
3. How the Relative Strength Index Works
RSI is shown as a number between 0 and 100. It measures recent price changes and tells you how strong (or weak) the price movement is. The closer it is to 100, the more overbought the asset. Near 0? Oversold territory.
4. Relative Strength Index Calculation
Okay, math time — but don’t worry, we’ll keep it simple.
The relative strength index calculation is:
RSI = 100 – (100 / (1 + RS))
Where:
RS (Relative Strength) = Average Gain / Average Loss
Typically, it uses 14 periods (like 14 days or hours) to smooth things out. Most charting platforms do this math for you — phew!
5. Overbought and Oversold: What Do They Mean?
Overbought (RSI > 70): The asset might be overpriced — a pullback could be near.
Oversold (RSI < 30): The asset might be underpriced — a bounce could be coming.
It’s not a guarantee, but it gives you a heads-up.
6. RSI Timeframes Explained
Different traders use different timeframes:
Short-term traders might use 5- or 14-minute charts.
Swing traders might look at 1-hour or daily RSI.
Long-term investors might use weekly RSI.
Shorter timeframes give faster signals but more noise. Longer timeframes give stronger signals but are slower.
7. RSI in Stock vs Crypto Markets
RSI works in both markets, but with a twist:
Stocks tend to follow fundamentals, so RSI might lag.
Crypto is more emotional and volatile, making RSI signals more frequent — and sometimes more powerful.
8. Common RSI Mistakes to Avoid
Using RSI alone: It’s a guide, not gospel.
Ignoring the trend: An overbought RSI in an uptrend doesn’t mean sell right away.
Overtrading: Chasing every RSI signal leads to losses.
Use RSI as part of a bigger picture.
9. RSI + Other Indicators = Winning Combo
Want better signals? Combine RSI with:
MACD for momentum confirmation
Moving Averages to identify trends
Volume to measure strength
When indicators agree, your odds improve.
10. RSI Divergence: A Powerful Signal
Divergence happens when the price goes one way, but RSI goes another. It often signals a reversal.
Bullish Divergence: Price makes lower lows, but RSI makes higher lows — possible rally.
Bearish Divergence: Price makes higher highs, but RSI makes lower highs — watch out.
11. RSI Strategies for Beginners
Start with these simple strategies:
RSI Bounce: Buy when RSI hits 30 and reverses upward.
RSI Breakout: Enter when RSI crosses 50 in the direction of the trend.
RSI Range Trading: Buy near 30, sell near 70 in sideways markets.
12. Advanced RSI Tactics
Experienced traders might:
Use RSI bands (like Bollinger Bands for RSI)
Apply dynamic RSI levels based on trend strength
Mix in Fibonacci levels for entry/exit points
Advanced, yes — but still RSI at heart.
13. When RSI Doesn’t Work
Nothing is perfect. RSI can fail when:
Markets are trending strongly (and just stay overbought/oversold)
News events create sudden price spikes
You’re using it in isolation without confirmation
That’s why it’s a guide, not a guarantee.
14. Real-Life RSI Example
Imagine you’re eyeing a stock or crypto. RSI is 28 — oversold. You wait, and it starts climbing. You buy. A few days later, RSI hits 68, and the price has jumped. You sell. Boom — a successful RSI trade. It’s not magic, just math and timing.
15. Final Thoughts: Is RSI Right for You?
the Relative Strength Index is like your market compass — it doesn’t tell you exactly where to go, but it helps you avoid walking into a storm. If you’re looking for a tool that’s easy to understand and surprisingly powerful, RSI is a great place to start.
FAQs
1. What is the best Relative Strength Index setting for beginners?
The default setting of 14 periods is perfect for beginners. It provides a good balance between speed and accuracy.
2. Can RSI be used for day trading?
Yes! Day traders often use the relative strength index on shorter timeframes (like 5 or 15 minutes) to catch quick moves.
3. Is RSI better than MACD?
Not better, just different. the relative strength index shows overbought/oversold conditions, while MACD shows trend direction. Together, they’re powerful.
4. Can Relative Strength Indexbe wrong?
Absolutely. No indicator is 100% accurate. Use RSI with other tools and always consider the overall market context.
5. What does an RSI of 50 mean?
It means the market is balanced — not overbought or oversold. It’s often seen during consolidation.
Now you’re equipped with the knowledge of RSI — go ahead, chart your success with us!